Understanding the YouTube Analytics is a crucial part to growing a successful YouTube channel. Even if you put 110% effort into your videos, it doesn’t mean you’ll succeed.
In this post you’ll learn valuable things about YouTube analytics, how to properly read them and I’ll answer the most common question I get – Why do I have good YouTube Analytics but YouTube is not recommending my videos?
That’s why knowing how to properly read YouTube Analytics is key when it comes to being successful on the platform.
In the post, we’ll go over the whole analytics page of one of my channels – Troll F1.
YOUTUBE ANALYTICS PAGE
Congratulations! You’ve uploaded your video! Now you have to wait 1-2 days for YouTube to load the analytics.
When that time passes, you’ll see multiple tabs of analytics about your video.
Five – or four, depending on whether you’re monetized or not – main tabs are:
- Overview
- Reach
- Engagement
- Audience
- Revenue
OVERVIEW
TOP OVERVIEW
On top of the overview tab, you’ll see general information about your video. This information is not how well your video might do. This information is a reflection on how your video is currently doing.
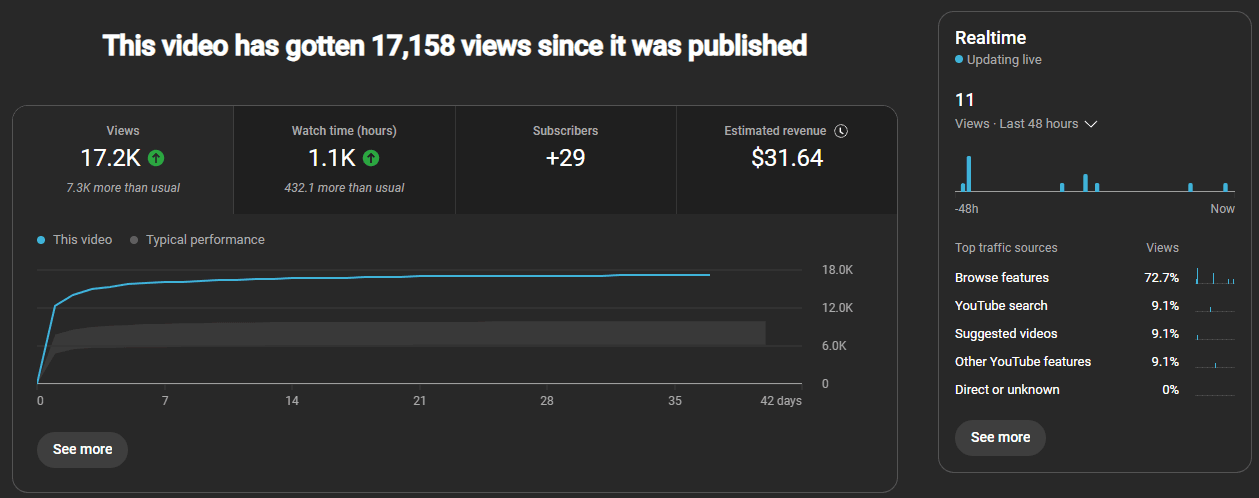
On the right side you can see Top traffic sources, which isn’t of a big importance, hence I’ll talk about it in the very next section and not in the Reach section where this parameter appears.
MIDDLE OVERVIEW
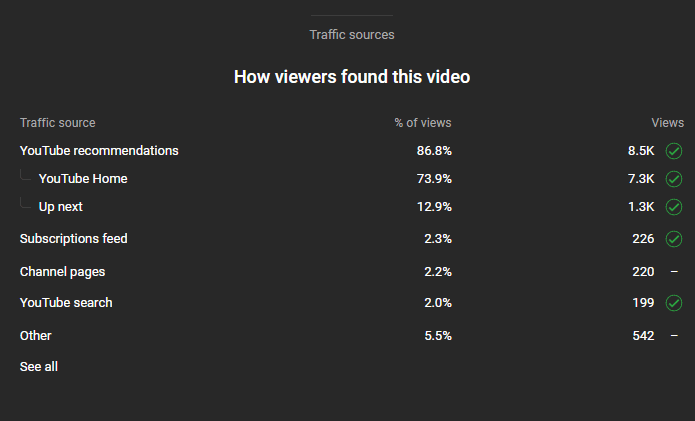
In the middle part – which YouTube doesn’t always show – you’ll get information on how viewers found your video – which can be useful, but it’s usually not crucial. The only time I found it to be crucial is when you share your videos on social media and wonder why YouTube is not pushing your videos. The best traffic source on YouTube is YouTube recommendations – YouTube Home and Up next. That’s when your video appears on people’s home page and recommendations while they’re watching other videos.
Keep in mind, YouTube recommends only videos with great analytics, so make sure to keep reading to gain important knowledge.
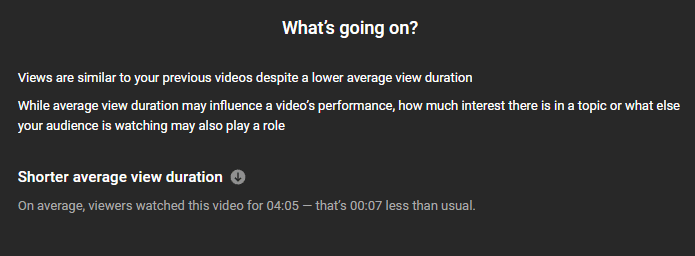
Also, you can, from time to time, find information titled What’s going on? – in this section YouTube will compare your video to a channel average and tell you what’s going on with your current video.
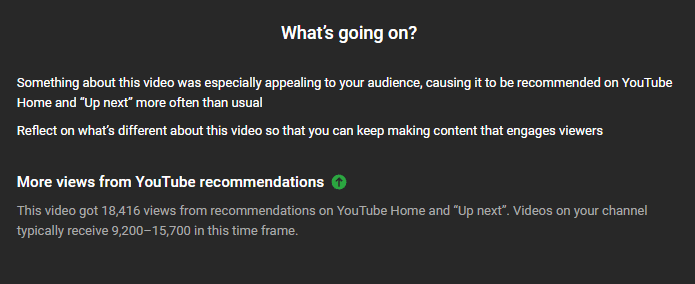
Also in the analytics, YouTube tells you when it recommends your video to people and how important that actually is.
BOTTOM OVERVIEW
At the bottom of your overview tab, you’ll see one of the two most important things in the whole YouTube Analytics – retention time – YouTube calls it Audience retention.
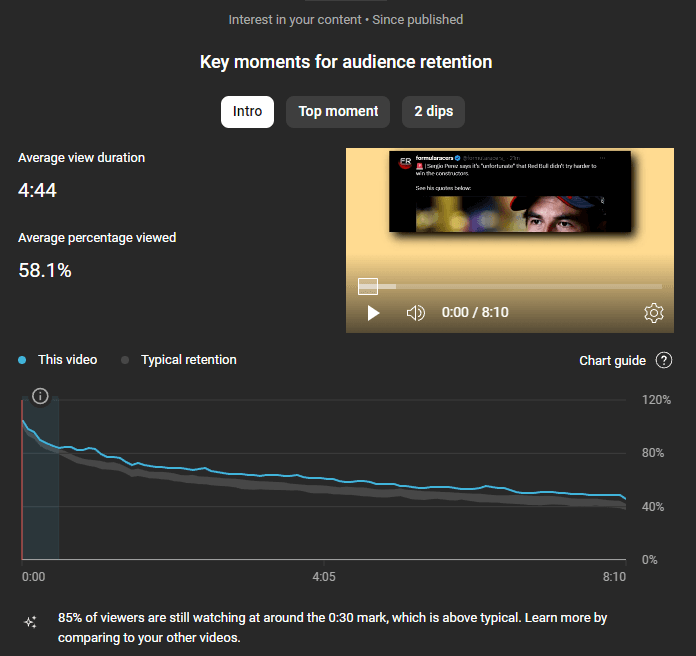
Retention time is how much of your video your viewers watch on average.
You can see your retention time in Engagement tab as well.
As you can see there are Average view duration and Average percentage viewed. Those two things are completely the same.
Beneath that is a graphic showing you a retention line. This is crucial. That retention line shows you how people watched your video, what parts they watched the most, where they left, dips and spikes, how well intro did and top moments of your video.
Behind the retention line, you can see typical retention of your channel. If your retention line is above that typical retention, great job!
INTRO
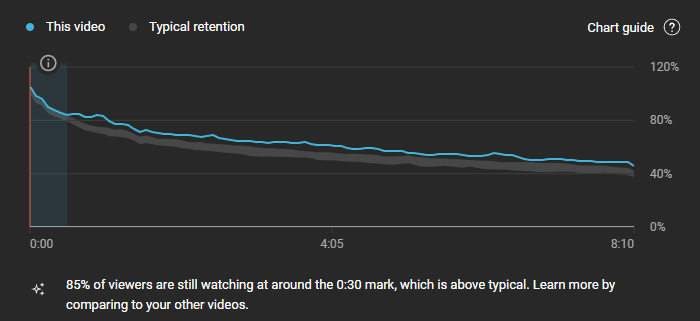
YouTube recognizes the first 30 seconds of your video as intro. Experiment with different intro ideas to bump this number to at least 80%. I recommend having more than 85%.
TOP MOMENT
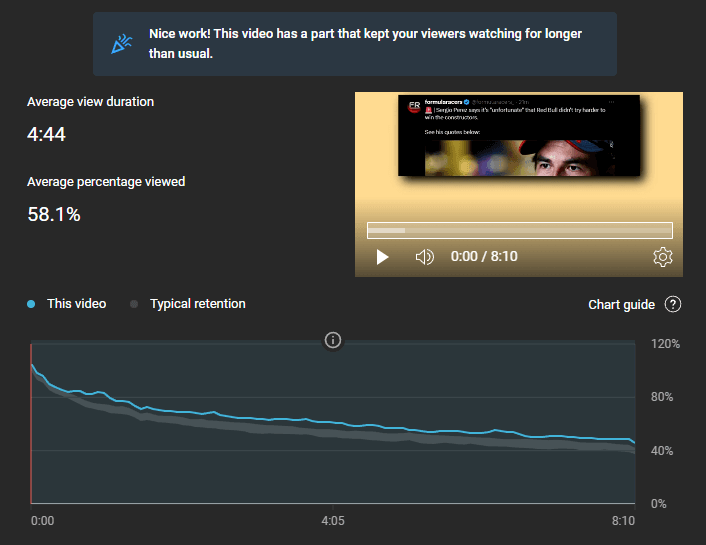
From my experience, although this isn’t the case every time – if your retention time is above 55% and people slowly and gradually leave your video – the whole video will be selected as a Top moment.
If that’s the case, great job!
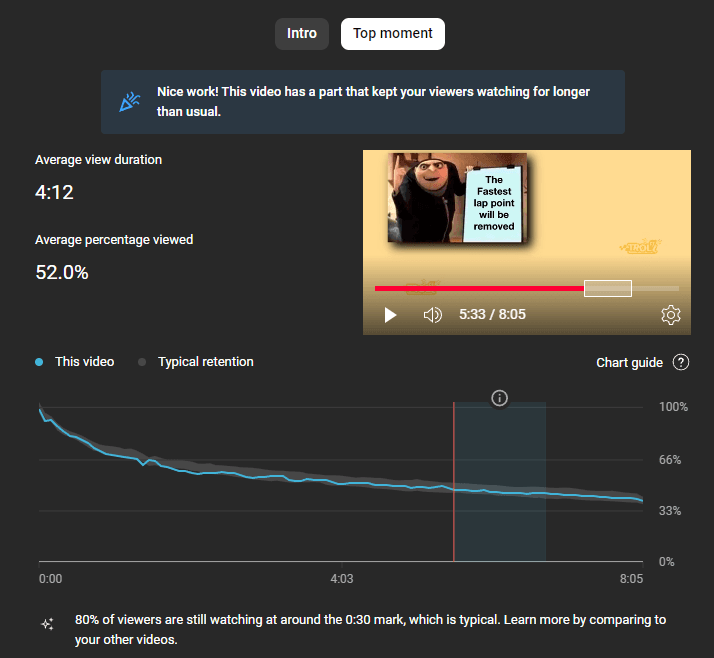
If your top moment is only a certain part, make sure to study that part and try to implement it to other parts of the video.
DIPS AND SPIKES
This one is self-explanatory.
When you see a huge drop-off on your retention line, it’s called a dip – you’ve done something that made people leave your video, or skip that part.
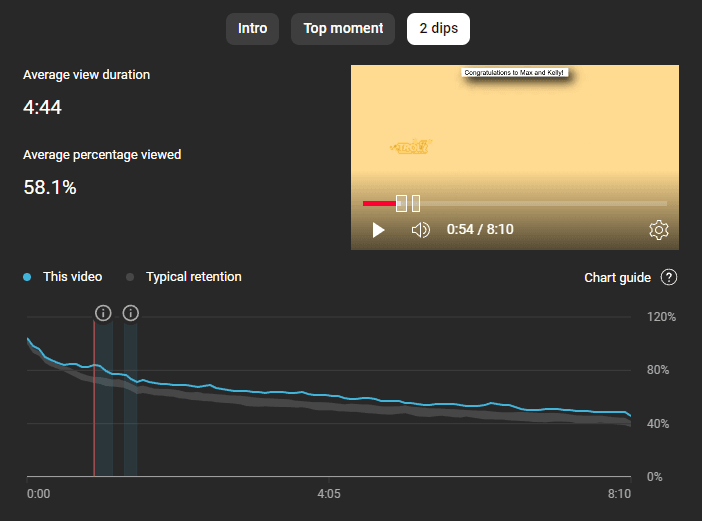
When you see a huge rise – also known as spike – from my experience, most of the time someone mentioned that part in the comments and everyone clicked on his timestamp sending them to that exact moment.
OUTRO
I keep my outros 5.5s long, that’s why my drop-off is a small one. Also I make my outro in the same manner as the rest of the video, so most people don’t even think of it as an outro.
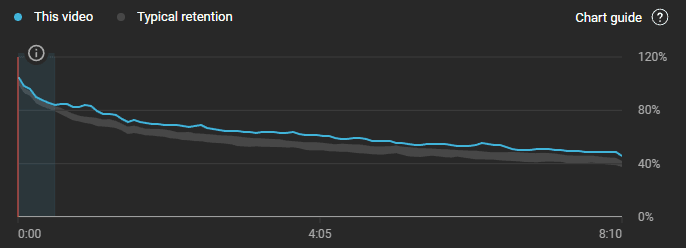
Here’s a retention time of a channel I’m working for which has a 20s long outro that people can obviously recognize as an outro.
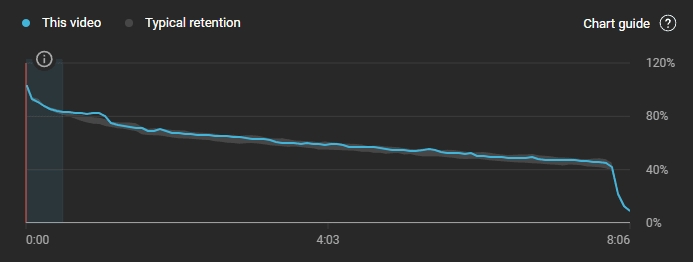
I recommend keeping your outro as short as possible or even non-existent.
In this article I talk about how to make profitable YouTube channel and videos.
REACH
Alongside Retention time, the Reach is the most important part you should learn how to read in YouTube Analytics.
Here, we’ll focus on only the key things including:
- Impressions
- Impressions click-through rate – CTR in short
- Thumbnail test
- External sites or apps
- Bell notifications sent
- YouTube search terms
There are other things in the Reach tab, but those aren’t of a big importance, they’re more informational than they’re key parameters. Although, I advise you to take a look at those too.
IMPRESSIONS
Impressions is the amount of times YouTube showed your video/thumbnail to people on the website since you’ve uploaded the video.
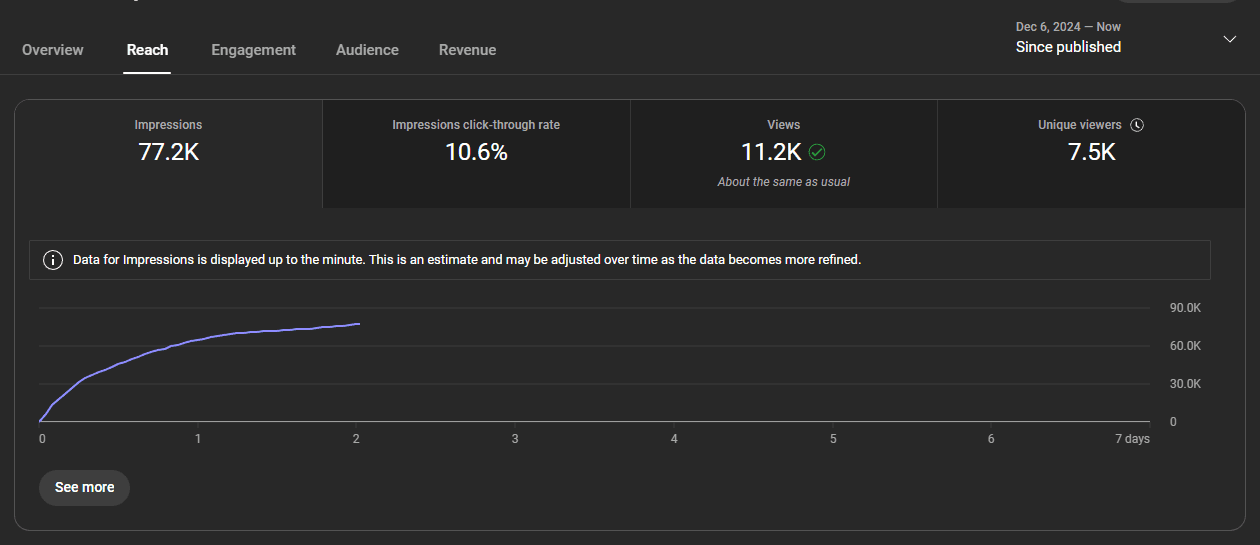
I look at impressions as the potential amount of views my video can make. Of course, you can’t make that amount of views, but with the right thumbnail, you should make at least impressions divided by 10 amount of views.
If you have 100k impressions, you should aim for at least 10k views.
That’s 10% CTR. And CTR is:
IMPRESSIONS CLICK-THROUGH RATE – CTR
CTR is a percentage of people who click on your video when it’s presented to them.
If you’re just starting a YouTube channel, your CTR will be low. As YouTube begins to show your video to more and more people, your CTR will gradually drop.
Most YouTubers aim for 12% CTR, which, in my opinion, is too high for most of us. If your videos are of the highest quality, then 12% is great. But if you’re a more casual YouTuber, you should aim for 8-10%. Anything above 10% along with a retention time of 55% or more can pretty much guarantee you a high amount of views.
If your CTR drops to almost 0%, try changing your thumbnail. Keep in mind YouTube is a long-term game. You won’t see the results of changing your thumbnails immediately.
THUMBNAIL TEST
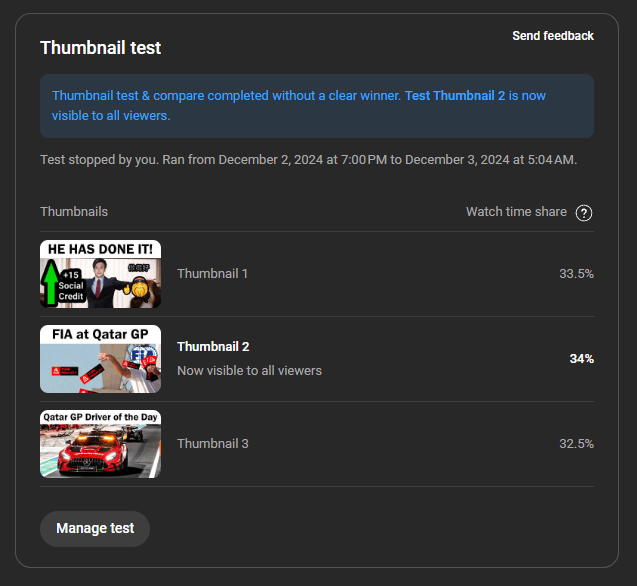
If you’re running a thumbnail test you’ll be able to see it in the Reach tab. I usually get test results after around 1,000 views.
YouTube usually tests thumbnails for days – up to 14 days, but from my experience that doesn’t change a single thing. You can stop it after 1 hour if you have the results ready.
Of course, set the best thumbnail as your main thumbnail.
EXTERNAL SITES OR APPS
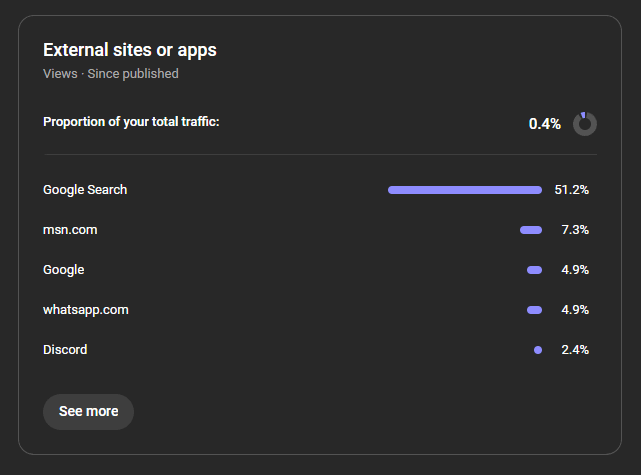
This metric is usually not important unless you’re sharing your videos on social media. That’s why I have to mention it. As I’ve already said, if your videos are struggling to get any traction due to you sharing them on third-party apps – usually social media – you can see it here.
Proportion of your total traffic, should be less than 1%. Even if it’s a bit above it, it shouldn’t be an issue, but keep it as low as possible. Organic YouTube traffic and views from subscribers are the best.
BELL NOTIFICATIONS SENT
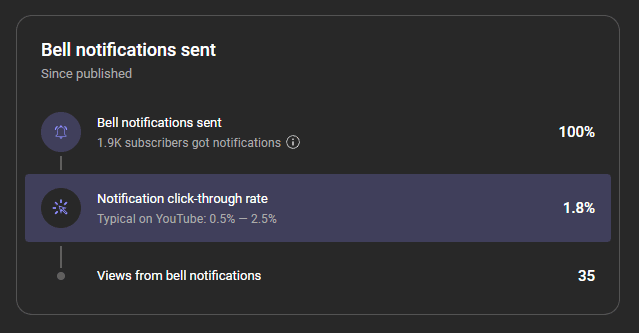
This metric shows you how many of your subscribers got the notification for your video.
It’s called Bell notifications because your subscribers need to hit the bell button to receive notifications from your channel.
Typical notification CTR is 0.5% – 2.5%, if it’s under 0.5% I advise you to uncheck Publish to subscriptions feed and notify subscribers while uploading a video. That way, your subscribers won’t get notifications.
YOUTUBE SEARCH TERMS
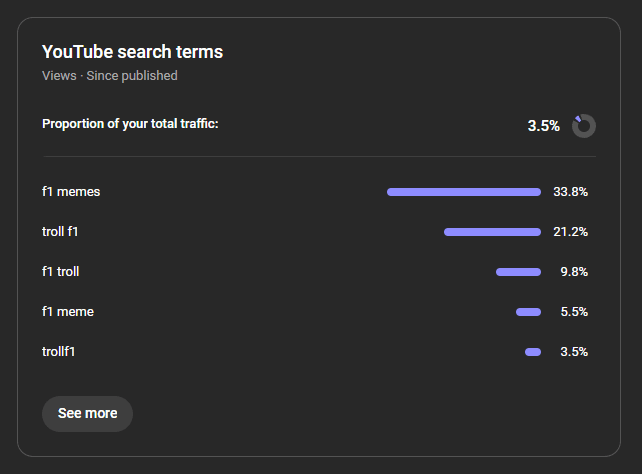
YouTube search terms are a great way to implement certain tags into your videos.
It shows you the most searched terms that lead people to your videos.
I put some of them as tags of my videos every time, and it boosts my views a bit.
ENGAGEMENT
I’ve already talked about audience retention which is the most important metric in Engagement tab.
There are still 2 not-so-important metrics:
- Likes (vs. dislikes)
- End screen element click rate
LIKES VS DISLIKES
Here you can see how your channel compares to the channel average in terms of likes vs dislikes ratio.
If your video is under the channel average by a few percent, you might have angered your viewers, or your video is controversial. You might want to stay from those topics in the future.
END SCREEN ELEMENT CLICK RATE
Here you can see the percentage of your viewers who actually clicked on the end screen on your video.
This is usually 1-3%. If it’s lower than 1%, try changing something on the outro of your video – recommend videos on your end screen, or tell people to subscribe. Make a CTA – Call to Action.
AUDIENCE
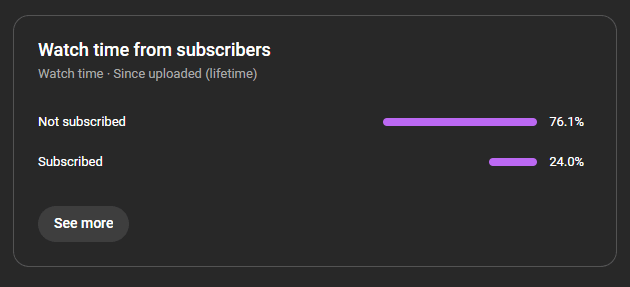
Audience tab in your YouTube Analytics is purely informational. There isn’t much to talk about here except for Watch time from subscribers.
If you’re tired of hearing your favorite YouTubers talk about how only 25% of people who watch their videos are subscribed, here’s where they get that metric from.
REVENUE
If your channel is monetized, this tab will appear to you. In some cases, you can see this tab even if you’re not monetized.
One of my channels got demonetized, and I can’t see Revenue on that channel anymore.
Something to keep in mind, YouTube updates revenue tab less frequently than anything else – I get mine updated once every day, and it’s not always 100% correct.
This tab as well is purely informational, there’s nothing here you should learn about in detail except for some general knowledge on how YouTube pays you, and what is CPM and RPM which you can learn by reading my post How Much Money Do You Make Per View on YouTube?
ADVANCED MODE
Advanced mode is unbelievably underrated and underused by YouTubers.
I use advanced mode to make comparisons between two videos. If I make some changes on a video B compared to video A, I’ll compare those changes in advanced mode.
Also, I like to compare analytics of videos that YouTube didn’t recommend with videos it did recommend. I’ll compare all the analytics from those two videos and find out why one video did well compared to the other.
Play with advanced mode, I’m sure you’ll have fun!
WHY DO I HAVE GOOD YOUTUBE ANALYTICS BUT YOUTUBE IS NOT RECOMMENDING MY VIDEOS
This question is the one you most often hear.
Just because you have good analytics on one video, it doesn’t mean YouTube will recommend it.
YouTube looks at your recent videos, takes into consideration analytics from those videos too, and only then decides whether to push your video to more people or not.
If you’re just starting with your channel, don’t expect a huge amount of views at the start – it can happen, but it’s very rare.
Instead, you should just focus on creating the highest quality videos you can, analyze everything properly, implement changes where needed and wait for the views to come.
In the past, I worked with channels with over 100,000 subscribers, yet they had less than 3,000 views.
Why? Their retention time was less than 30% on every video with CTR less than 5%. Even though some of our videos had over 50% retention time and 9% CTR, and everything in analytics was great – YouTube didn’t recommend our video.
SUMMARY
No matter how good your videos are, you should learn how to properly read YouTube Analytics metrics. Knowing and mastering it will benefit you exponentially.
Feel free to experiment in order to improve your analytics. Study and learn how people react to different things and parts of your videos to get the best possible outcome.
